

Ethereum’s rebound has cooled off following yet another failed attempt to push through the overhead resistance level. The market is still holding above its February base, which keeps the broader recovery idea alive, but the latest rejection shows that bulls are not in full control yet. For now, ETH looks caught between a still-improving short-term structure and a higher-timeframe trend that remains fragile.
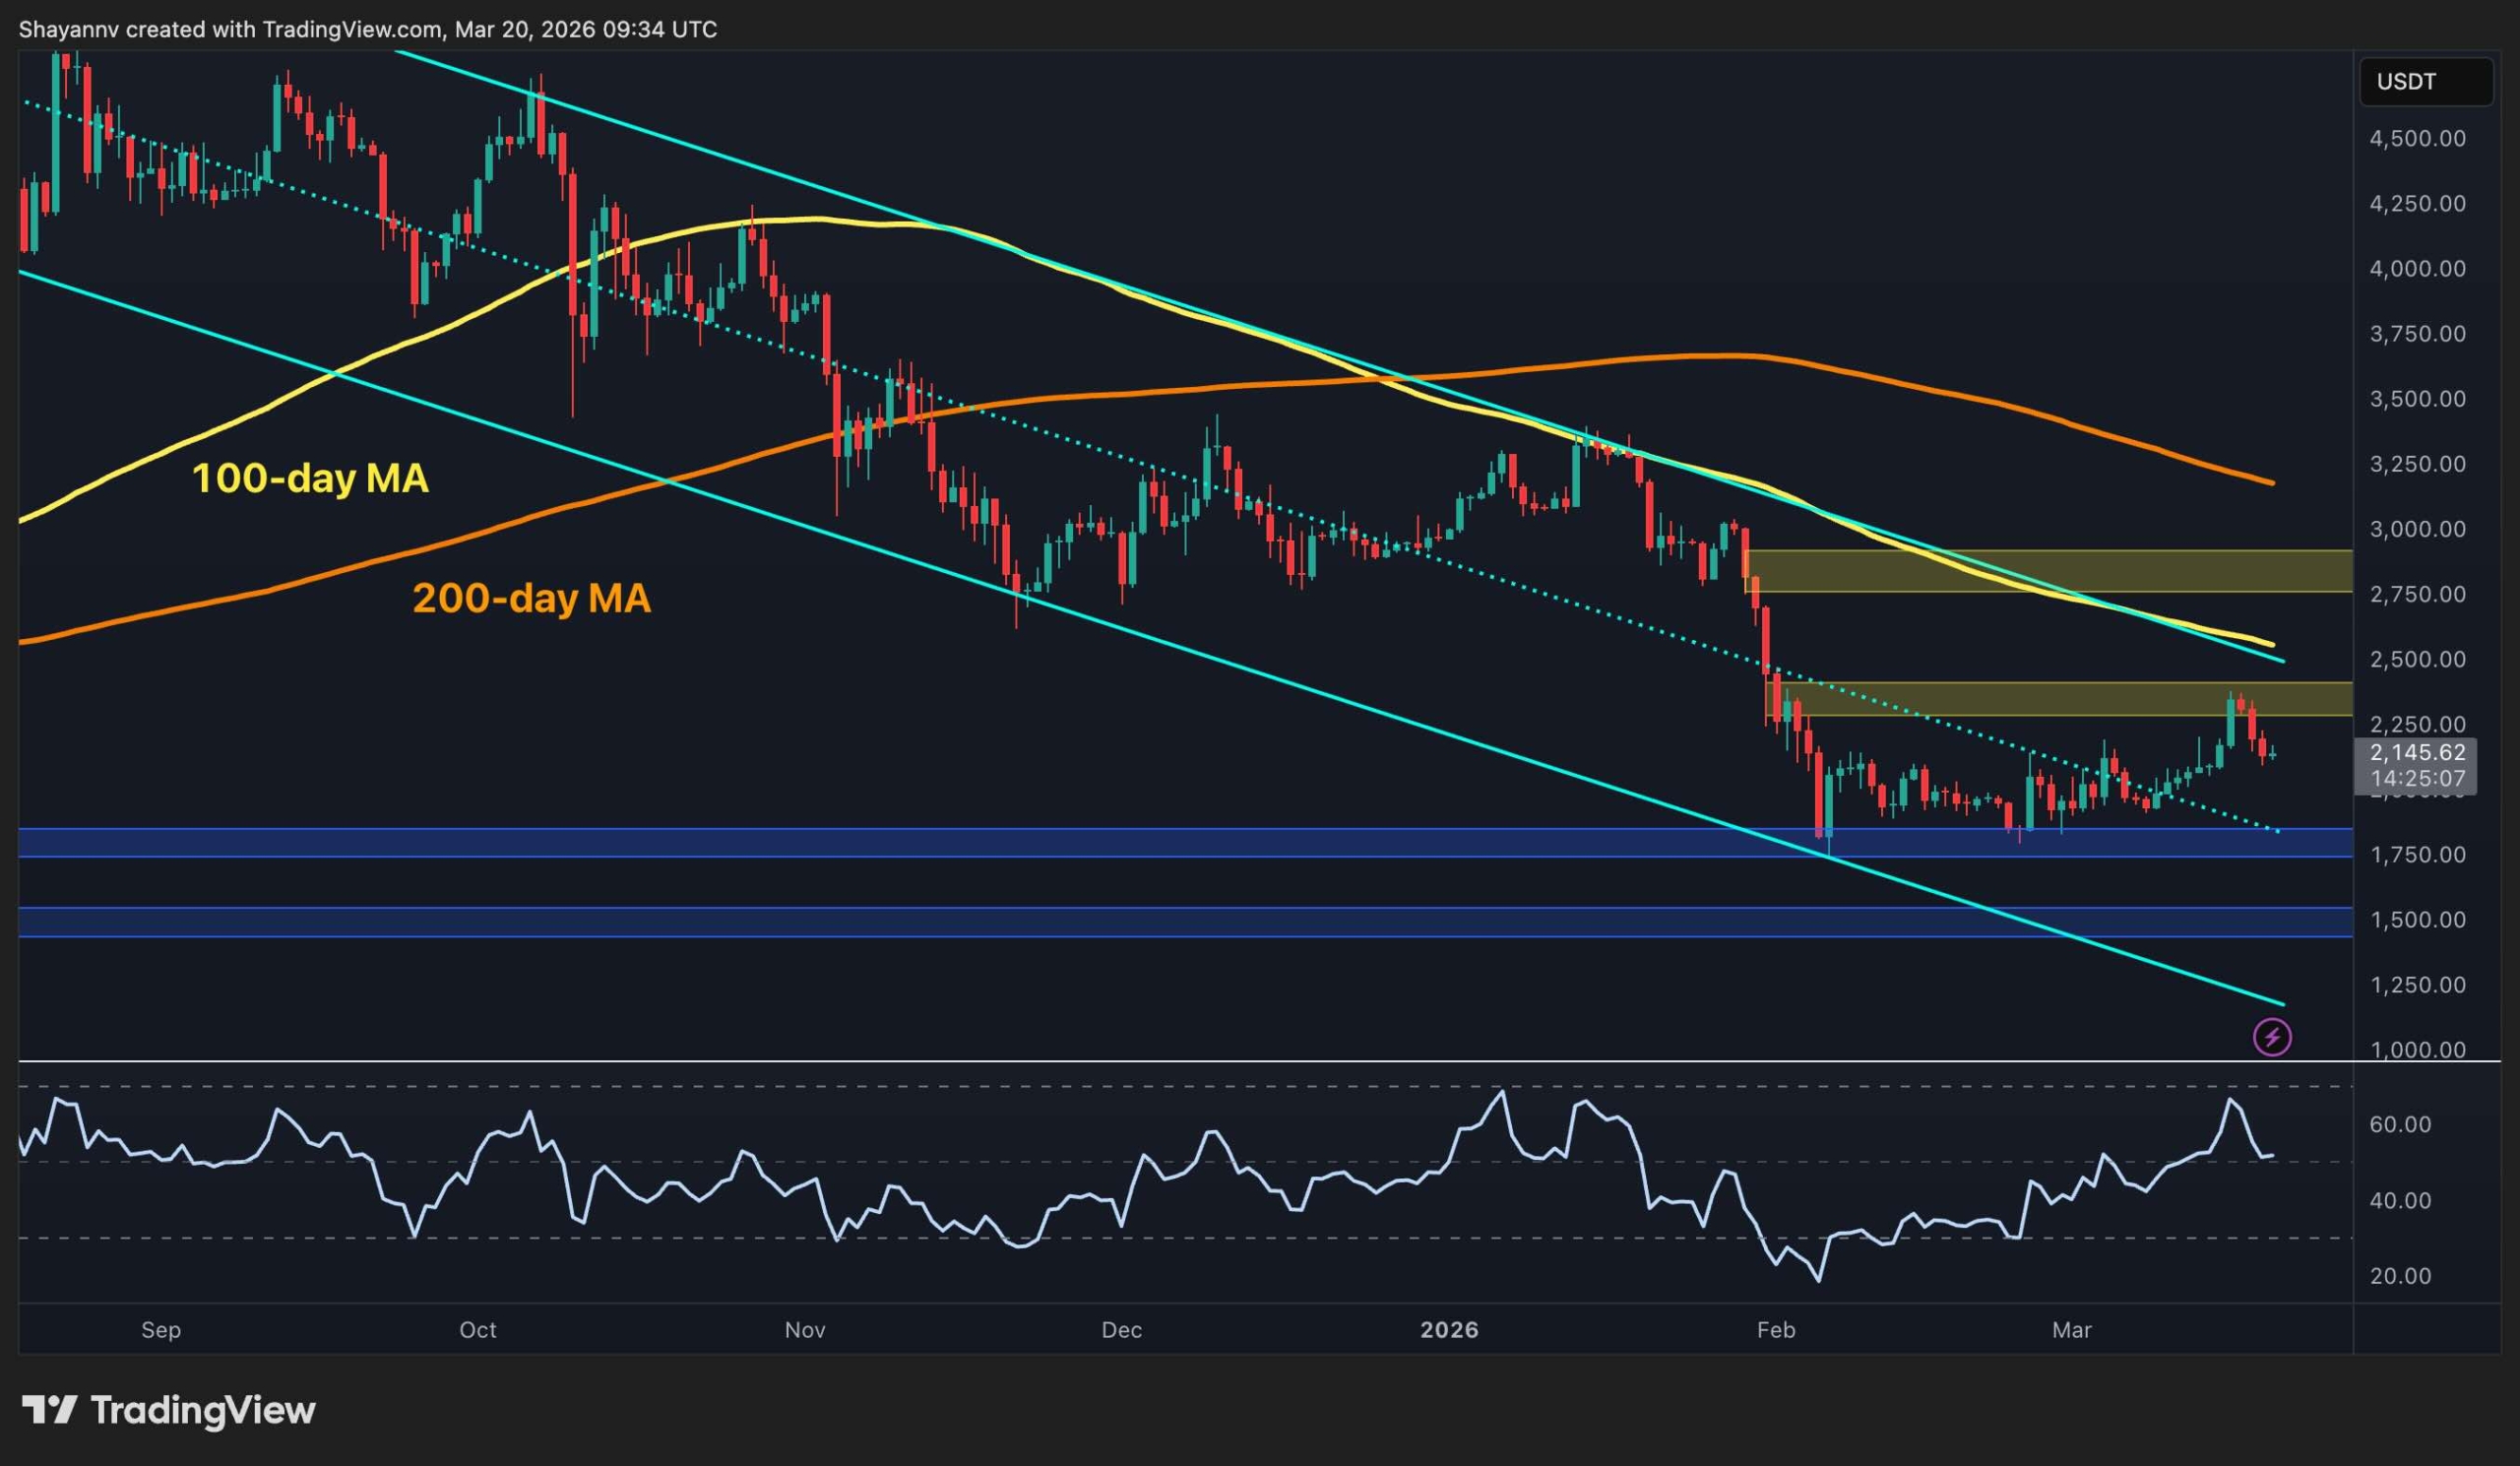
Ethereum Price Analysis: The Daily Chart
On the daily chart, ETH is still trading below the 100-day and 200-day moving averages, located around the $2.6k and $3.2k levels, respectively. Therefore, the broader structure remains bearish despite the recovery from the lows. The market has improved noticeably since the bounce from the $1.8k area, but it is still moving beneath major trend resistance and below the key supply zones that would need to break for a more decisive reversal.
The closest upside barrier sits around $2.3k to $2.4k, which has once again rejected the price. The next, larger resistance zone is near the $2.8k mark, and is the decisive area where ETH would need to break before the market can be considered bullish again. At the moment, the recent upside looks more like a rebound within a damaged structure than a clean trend change. On the downside, the $1.8k support zone remains the key floor holding the whole recovery together.
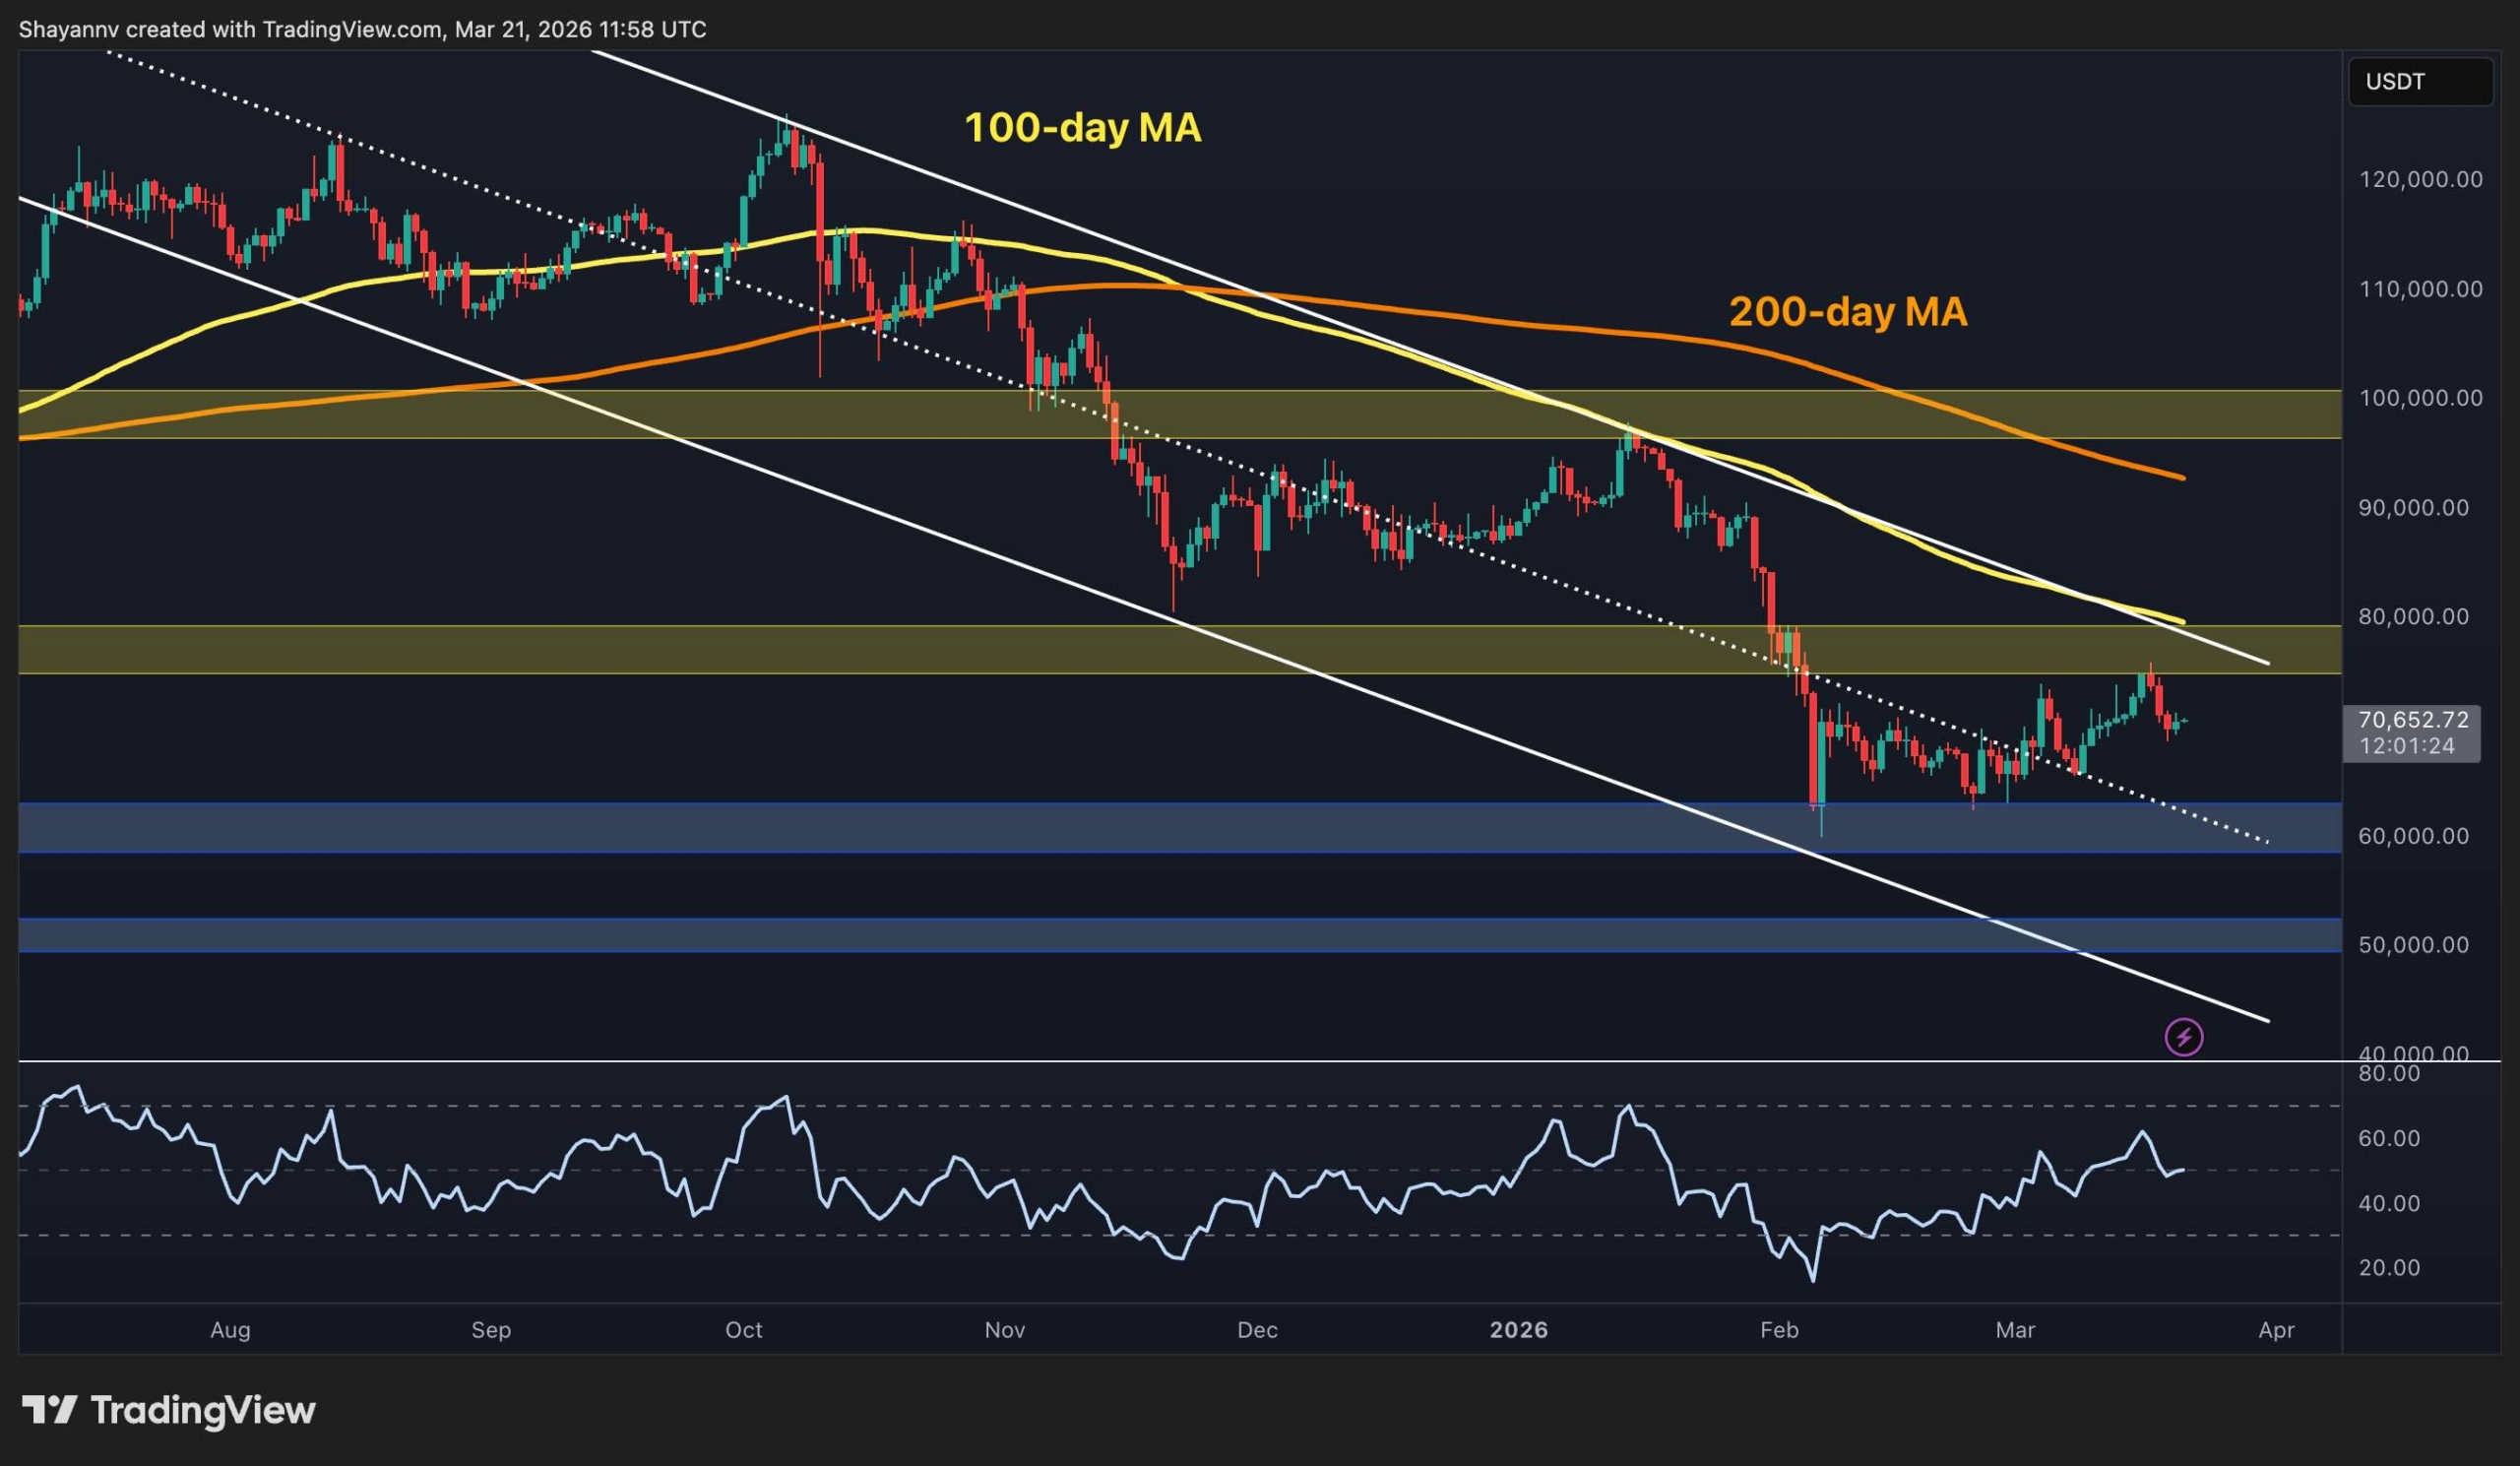
ETH/USDT 4-Hour Chart
The 4-hour chart shows the recent rejection more clearly. ETH had been climbing inside a rising channel and managed to briefly push above its higher boundary and into the $2.4k resistance area. Yet, the breakout failed, and the price slipped back below the upper boundary, making it a classical fake breakout. This failed move, combined with the RSI dropping off from an overbought state and below 50, suggests short-term momentum has weakened significantly.
This does not automatically mean the uptrend is over, but it does raise the odds of a deeper consolidation phase. If ETH loses traction here, the first area to watch is the $2k region, where the lower boundary of the channel is located. The next critical demand zone is the same $1.8k area also marked on the daily timeframe, and it’s necessary for the market to hold this zone to avoid a more steep decline.
On the other hand, if buyers reclaim $2.4k and hold above it, the market could quickly make another run toward the upper daily resistance levels, but this scenario seems distant at the moment.
Sentiment Analysis
Ethereum’s market sentiment has improved slightly, compared to the panic seen earlier in the year, but it is still not fully convincing. The Coinbase Premium Index has recovered from deeply negative readings and recently moved back into mildly positive territory, which suggests US spot demand has returned to some extent. That is a constructive shift, especially after the heavy weakness seen during the selloff. It indicates that the US institutions might be returning to the market after being consistent sellers since the beginning of the year.
Still, the premium remains relatively modest and does not yet reflect aggressive accumulation either. In other words, while the sentiment is surely showing a better market state, it’s not strong enough to fully validate a sustained breakout on its own. As a result, the mood around ETH can be described as cautiously constructive rather than outright bullish.
Binance Free $600 (CryptoPotato Exclusive): Use this link to register a new account and receive $600 exclusive welcome offer on Binance (full details).
LIMITED OFFER for CryptoPotato readers at Bybit: Use this link to register and open a $500 FREE position on any coin!
Disclaimer: Information found on CryptoPotato is those of writers quoted. It does not represent the opinions of CryptoPotato on whether to buy, sell, or hold any investments. You are advised to conduct your own research before making any investment decisions. Use provided information at your own risk. See Disclaimer for more information.


")
Leave a Comment