

Bitcoin is pushing into a more decisive part of its recovery. After spending weeks rebuilding from the February flush, the market is no longer just defending support. It is now pressing toward a key resistance cluster around the $80K, which makes this the kind of area where a simple relief rally either matures into something bigger or gets rejected back into range.
Bitcoin Price Analysis: The Daily Chart
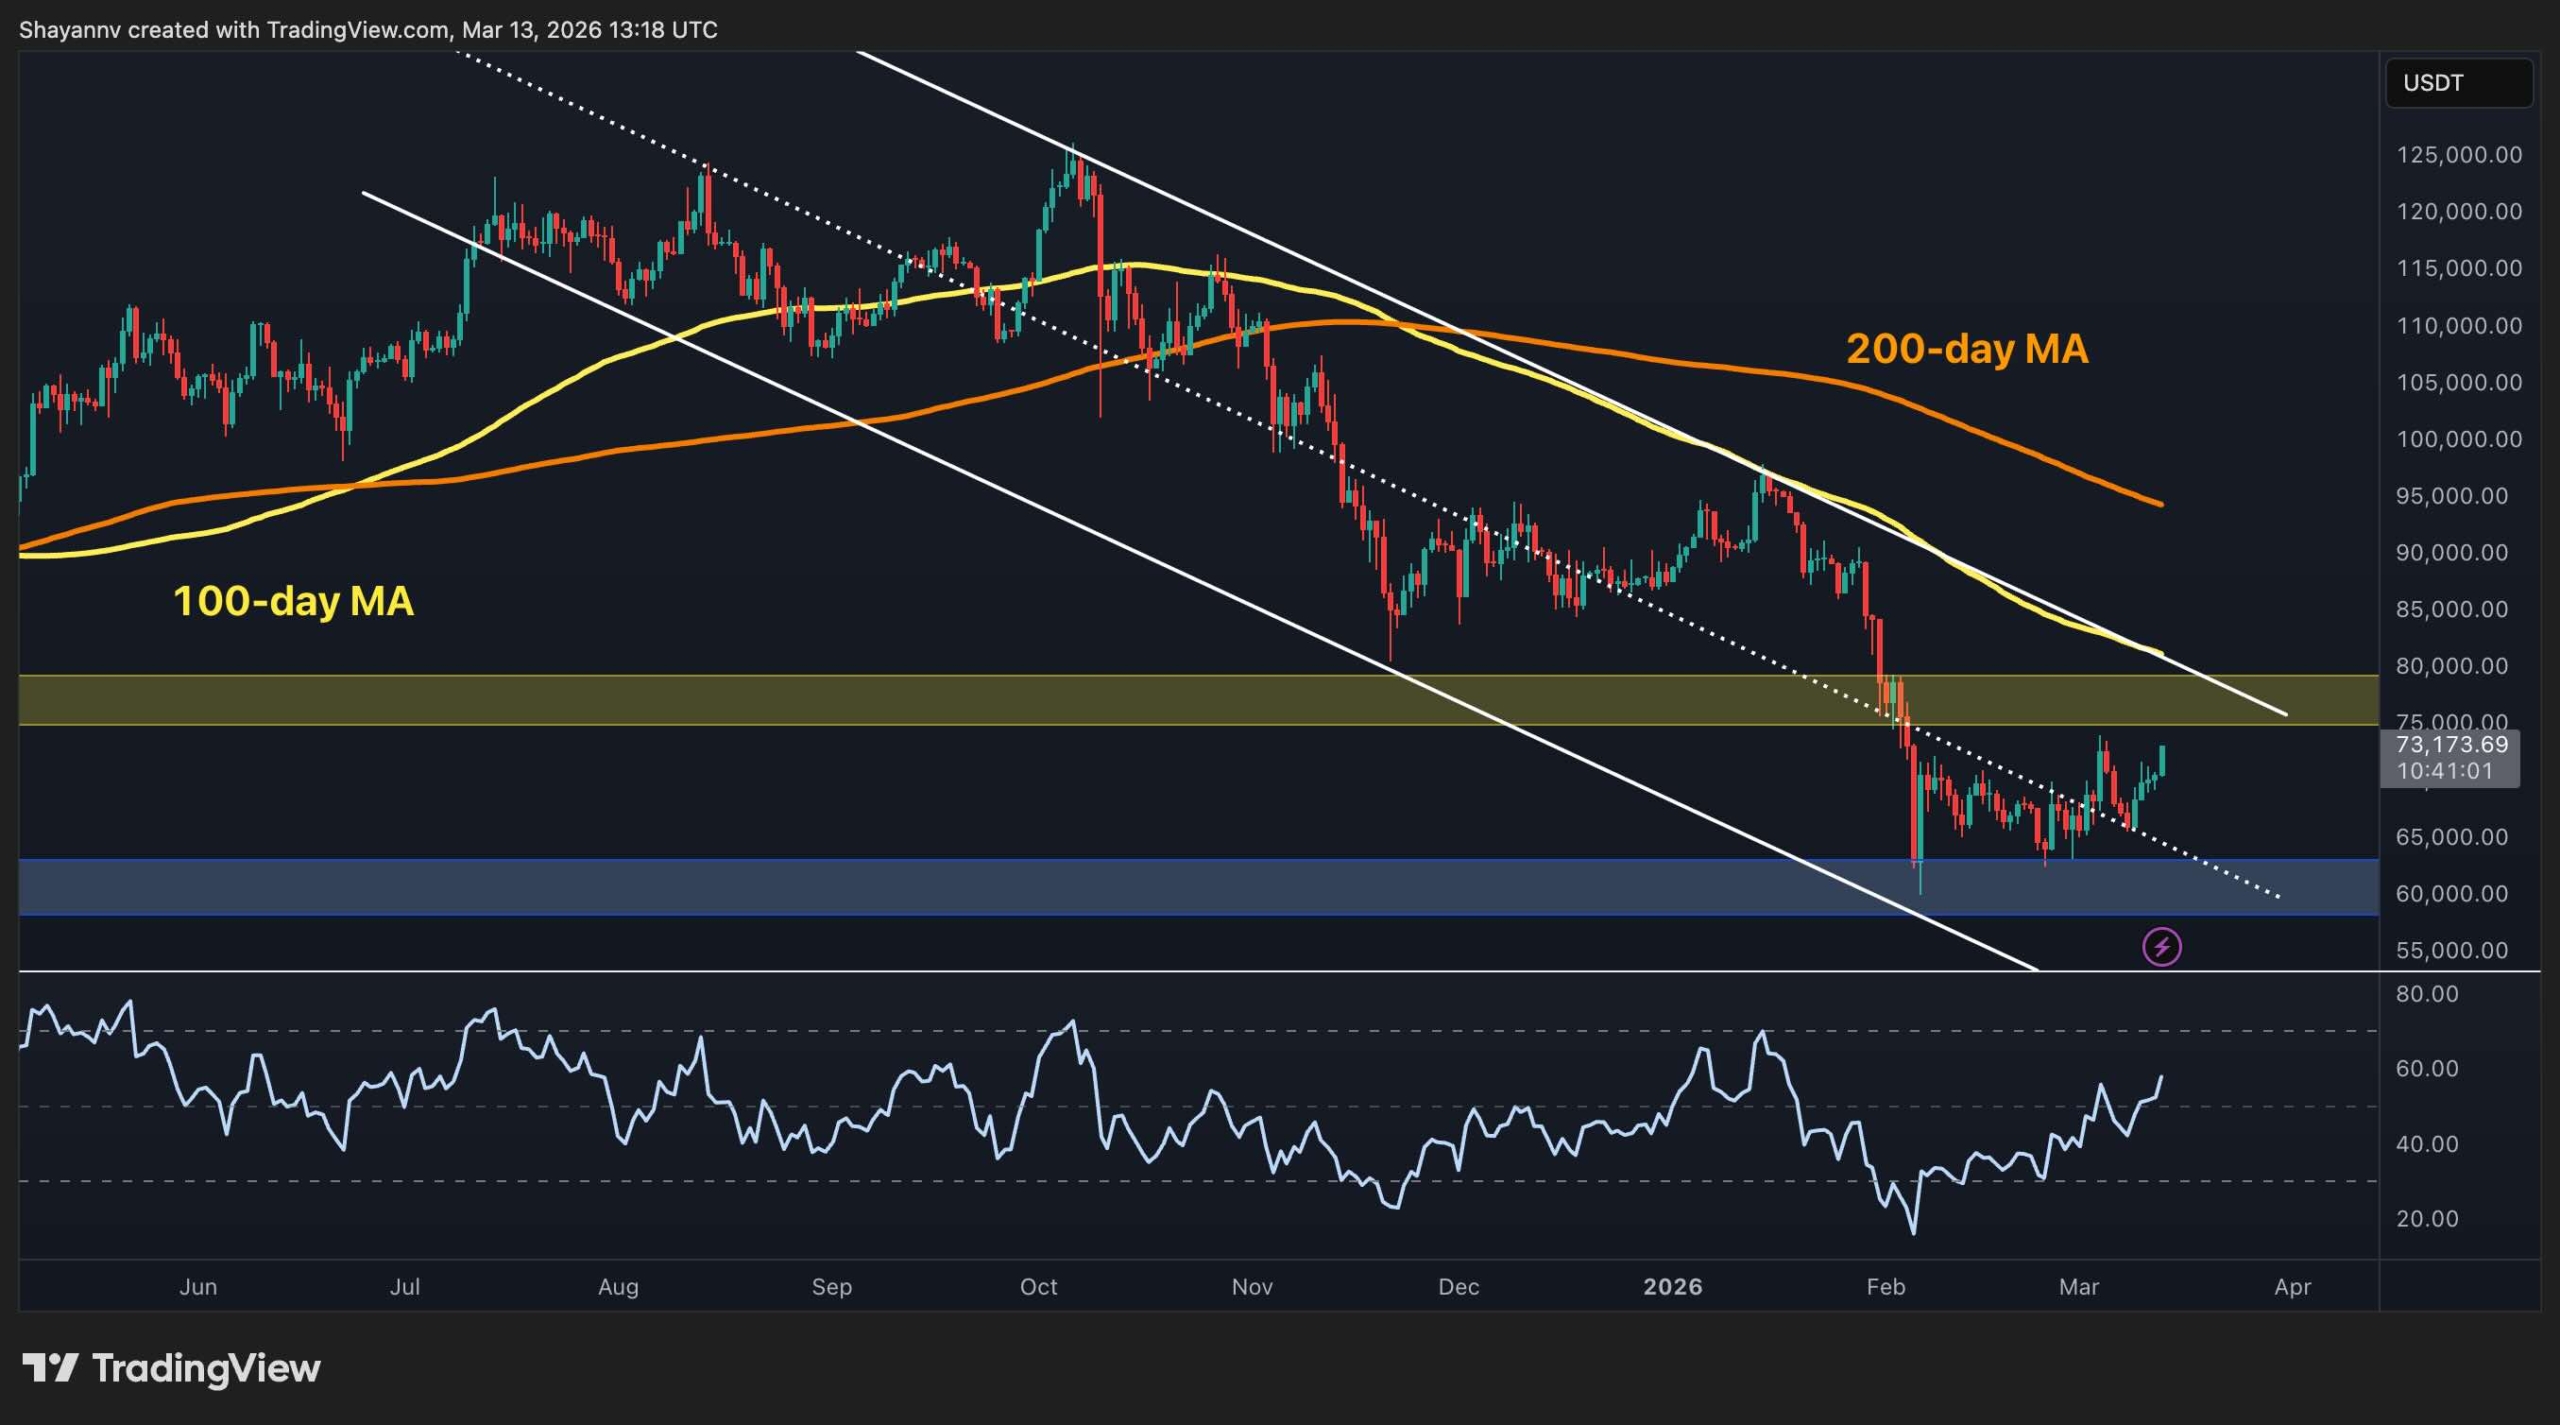
The daily chart is improving, but it has not fully turned bullish yet. BTC has managed to climb from the blue demand area near $60K to $62K and is now moving toward the old breakdown region around $75K to $80K. That is an important development, because this yellow zone acted as support before the market lost it during the broader downtrend. Reaching it again shows that buyers have regained some control, but reclaiming it is a different question altogether.
The broader structure still asks for caution. The price remains below the declining 100-day and 200-day moving averages, and both of them are still sloping lower, which means the macro trend has not been repaired yet. In other words, BTC is rallying into overhead supply while still sitting under major trend filters. If buyers can force a daily acceptance above the $75K area, the technical picture would improve materially. If not, this remains a rebound inside a larger corrective phase.
BTC/USDT 4-Hour Chart
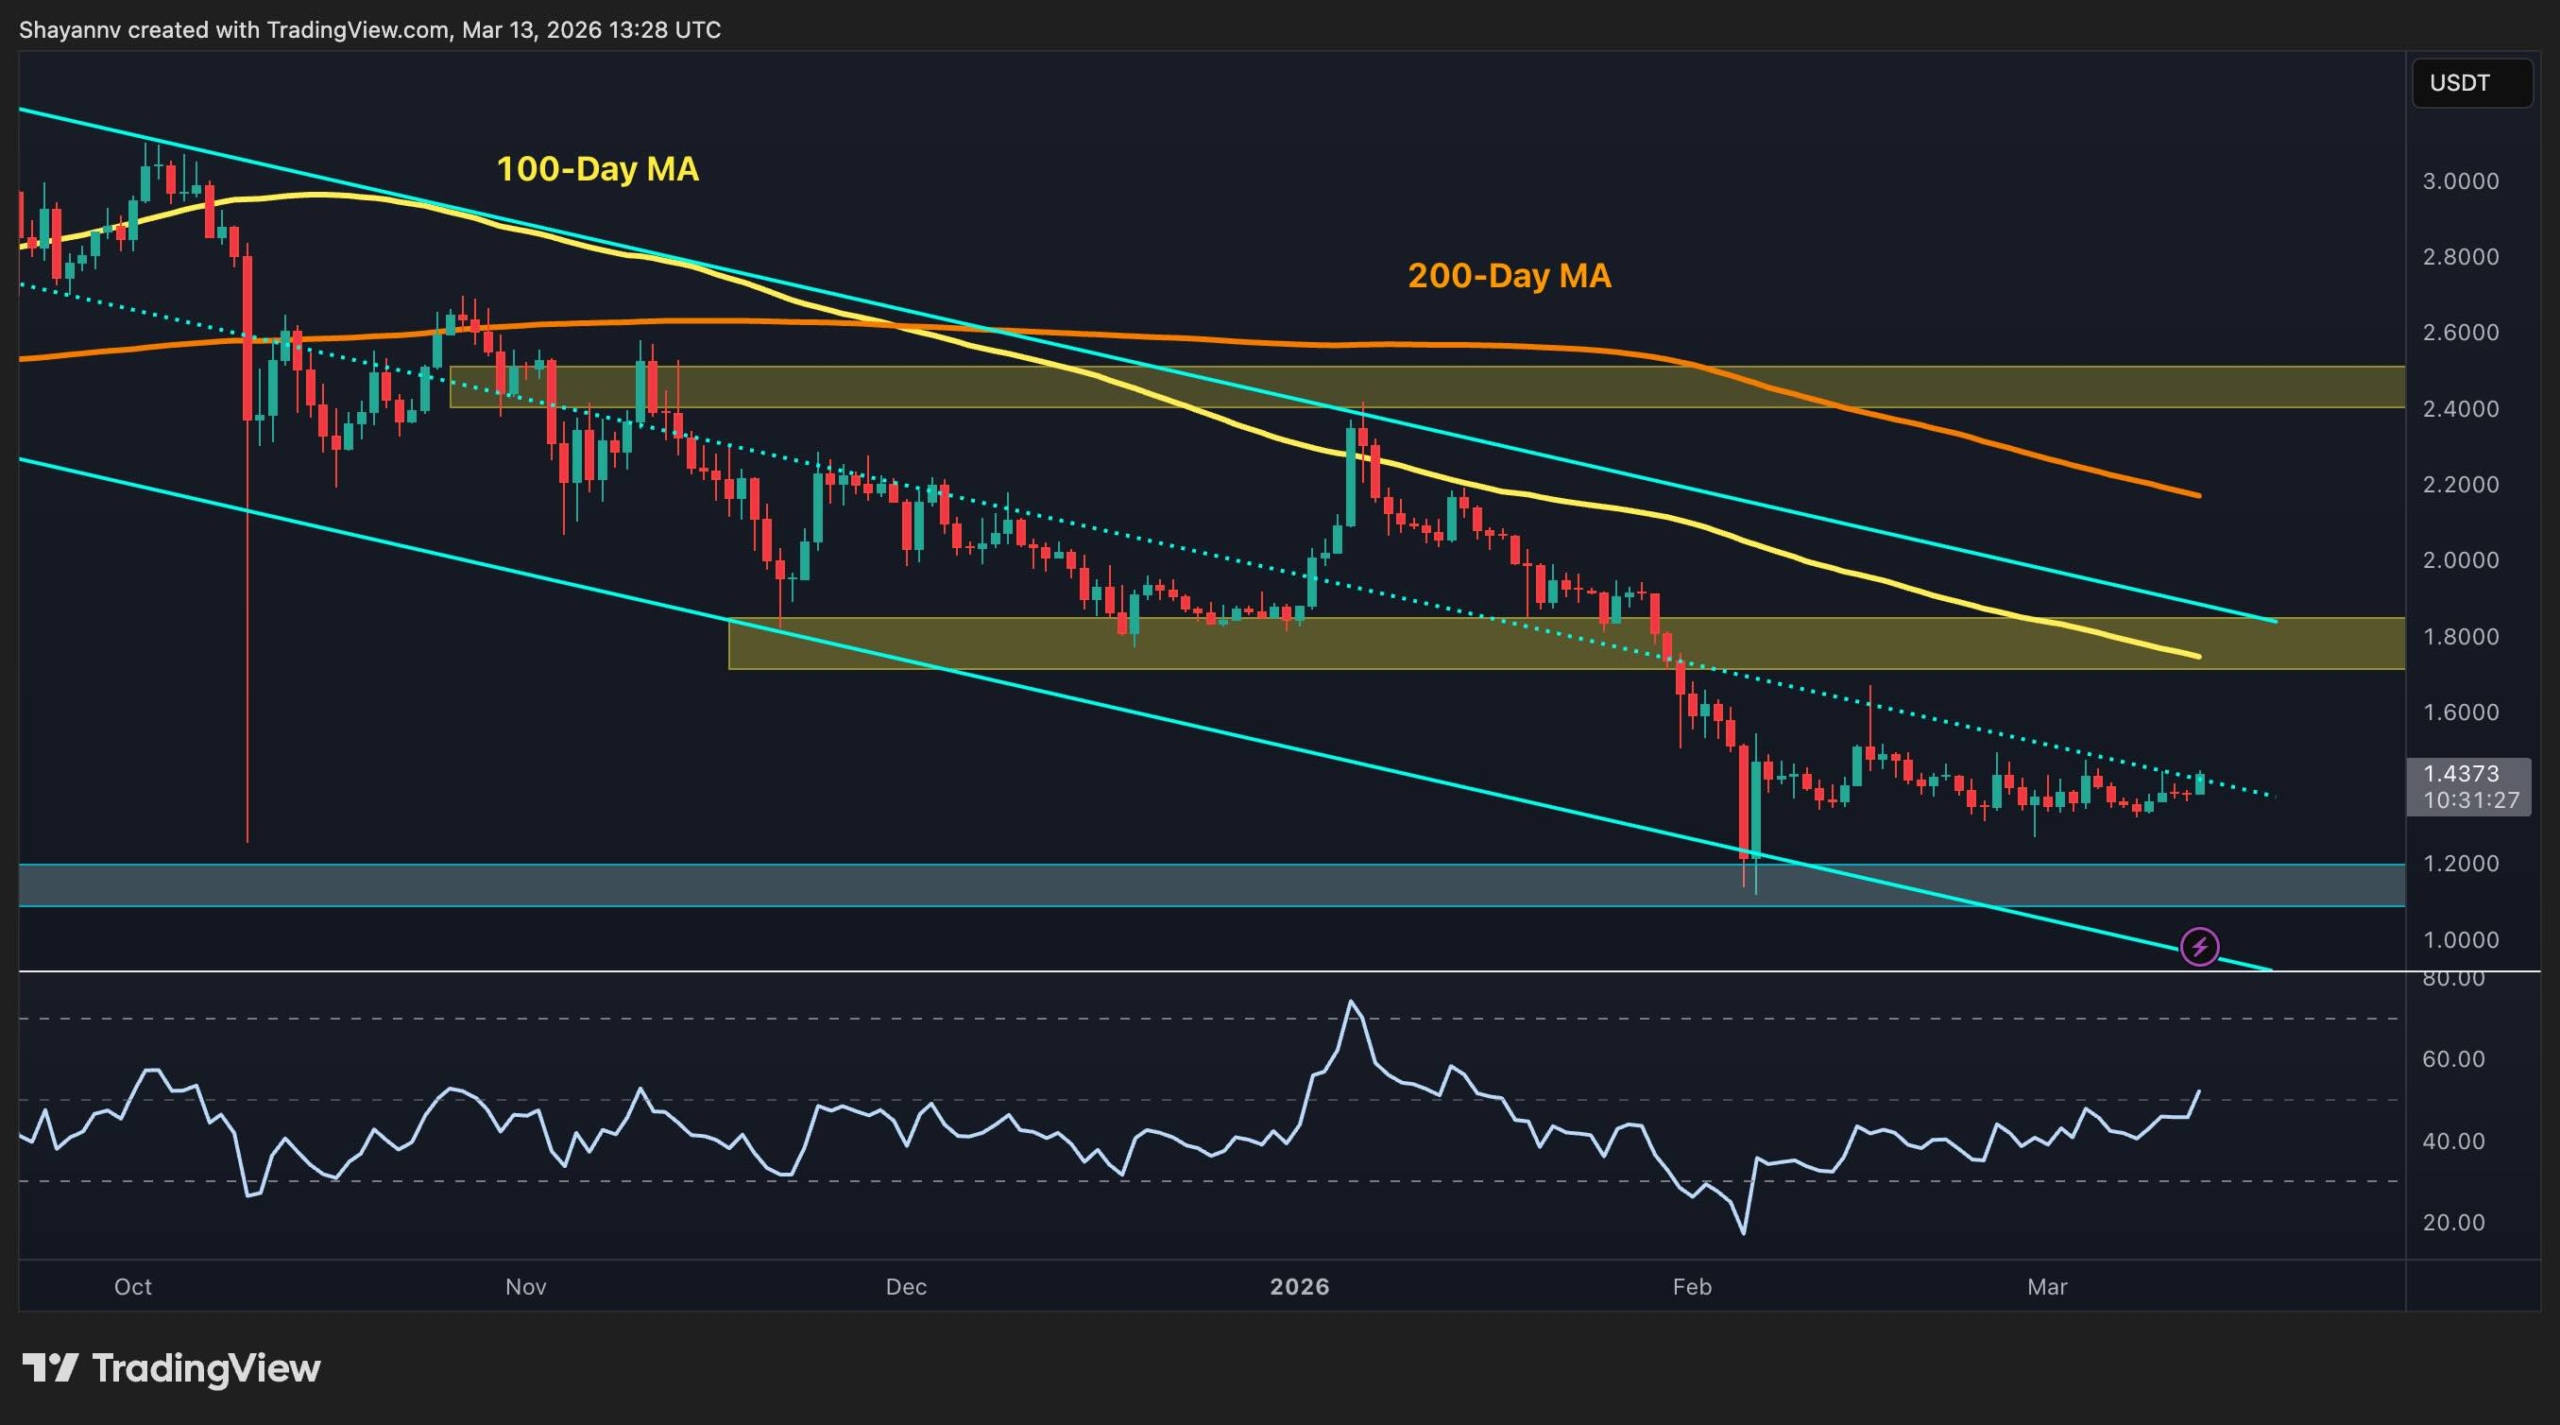
On the 4-hour chart, the recovery looks much cleaner. Bitcoin has been carving out a rising structure with higher lows, and the latest leg higher has carried the price right back toward the upper boundary of that formation. The market is not drifting upward anymore. It is actively pressing resistance, and that usually precedes either a breakout or a sharp reaction.
Momentum supports the idea of short-term strength, with RSI pushing into the upper end of its range. Still, that also means BTC is arriving at resistance with momentum already stretched. So the next move matters. A clean break above the channel top and the $73K to $75K supply band would suggest continuation toward the next overhead zones. A rejection here, on the other hand, would likely send the price back toward the mid-range and keep the market trapped in consolidation for longer.
On-Chain Analysis
The on-chain backdrop adds an interesting twist. Bitcoin’s adjusted SOPR is still below 1, which means coins moving on-chain are, on average, still being spent at a loss. That tends to happen in corrective or transitional phases, when the market has not yet fully returned to profit-taking behavior. So despite the recent price recovery, the network data suggests the broader reset is not entirely over.
At the same time, aSOPR has started to rebound from its recent lows, which is an early sign of improving conditions. That does not confirm a new expansion phase on its own, but it does hint that the worst of the capitulation pressure may already be behind the market. Put differently, price is testing resistance while on-chain behavior is trying to heal. If those two start aligning through a confirmed breakout on the chart and a move back above 1 on aSOPR, Bitcoin’s outlook would become much stronger.
Binance Free $600 (CryptoPotato Exclusive): Use this link to register a new account and receive $600 exclusive welcome offer on Binance (full details).
LIMITED OFFER for CryptoPotato readers at Bybit: Use this link to register and open a $500 FREE position on any coin!
Disclaimer: Information found on CryptoPotato is those of writers quoted. It does not represent the opinions of CryptoPotato on whether to buy, sell, or hold any investments. You are advised to conduct your own research before making any investment decisions. Use provided information at your own risk. See Disclaimer for more information.


")
Leave a Comment