

Bitcoin is extending its recovery, but the market is now approaching a more meaningful technical decision point. After holding the $60,000 region and building a series of higher lows, BTC has pushed back into the low-$70,000s, where short-term momentum is improving. Still, the broader structure has not fully flipped bullish, which means this move is best viewed as a test of resistance until proven otherwise.
Bitcoin Price Analysis: The Daily Chart
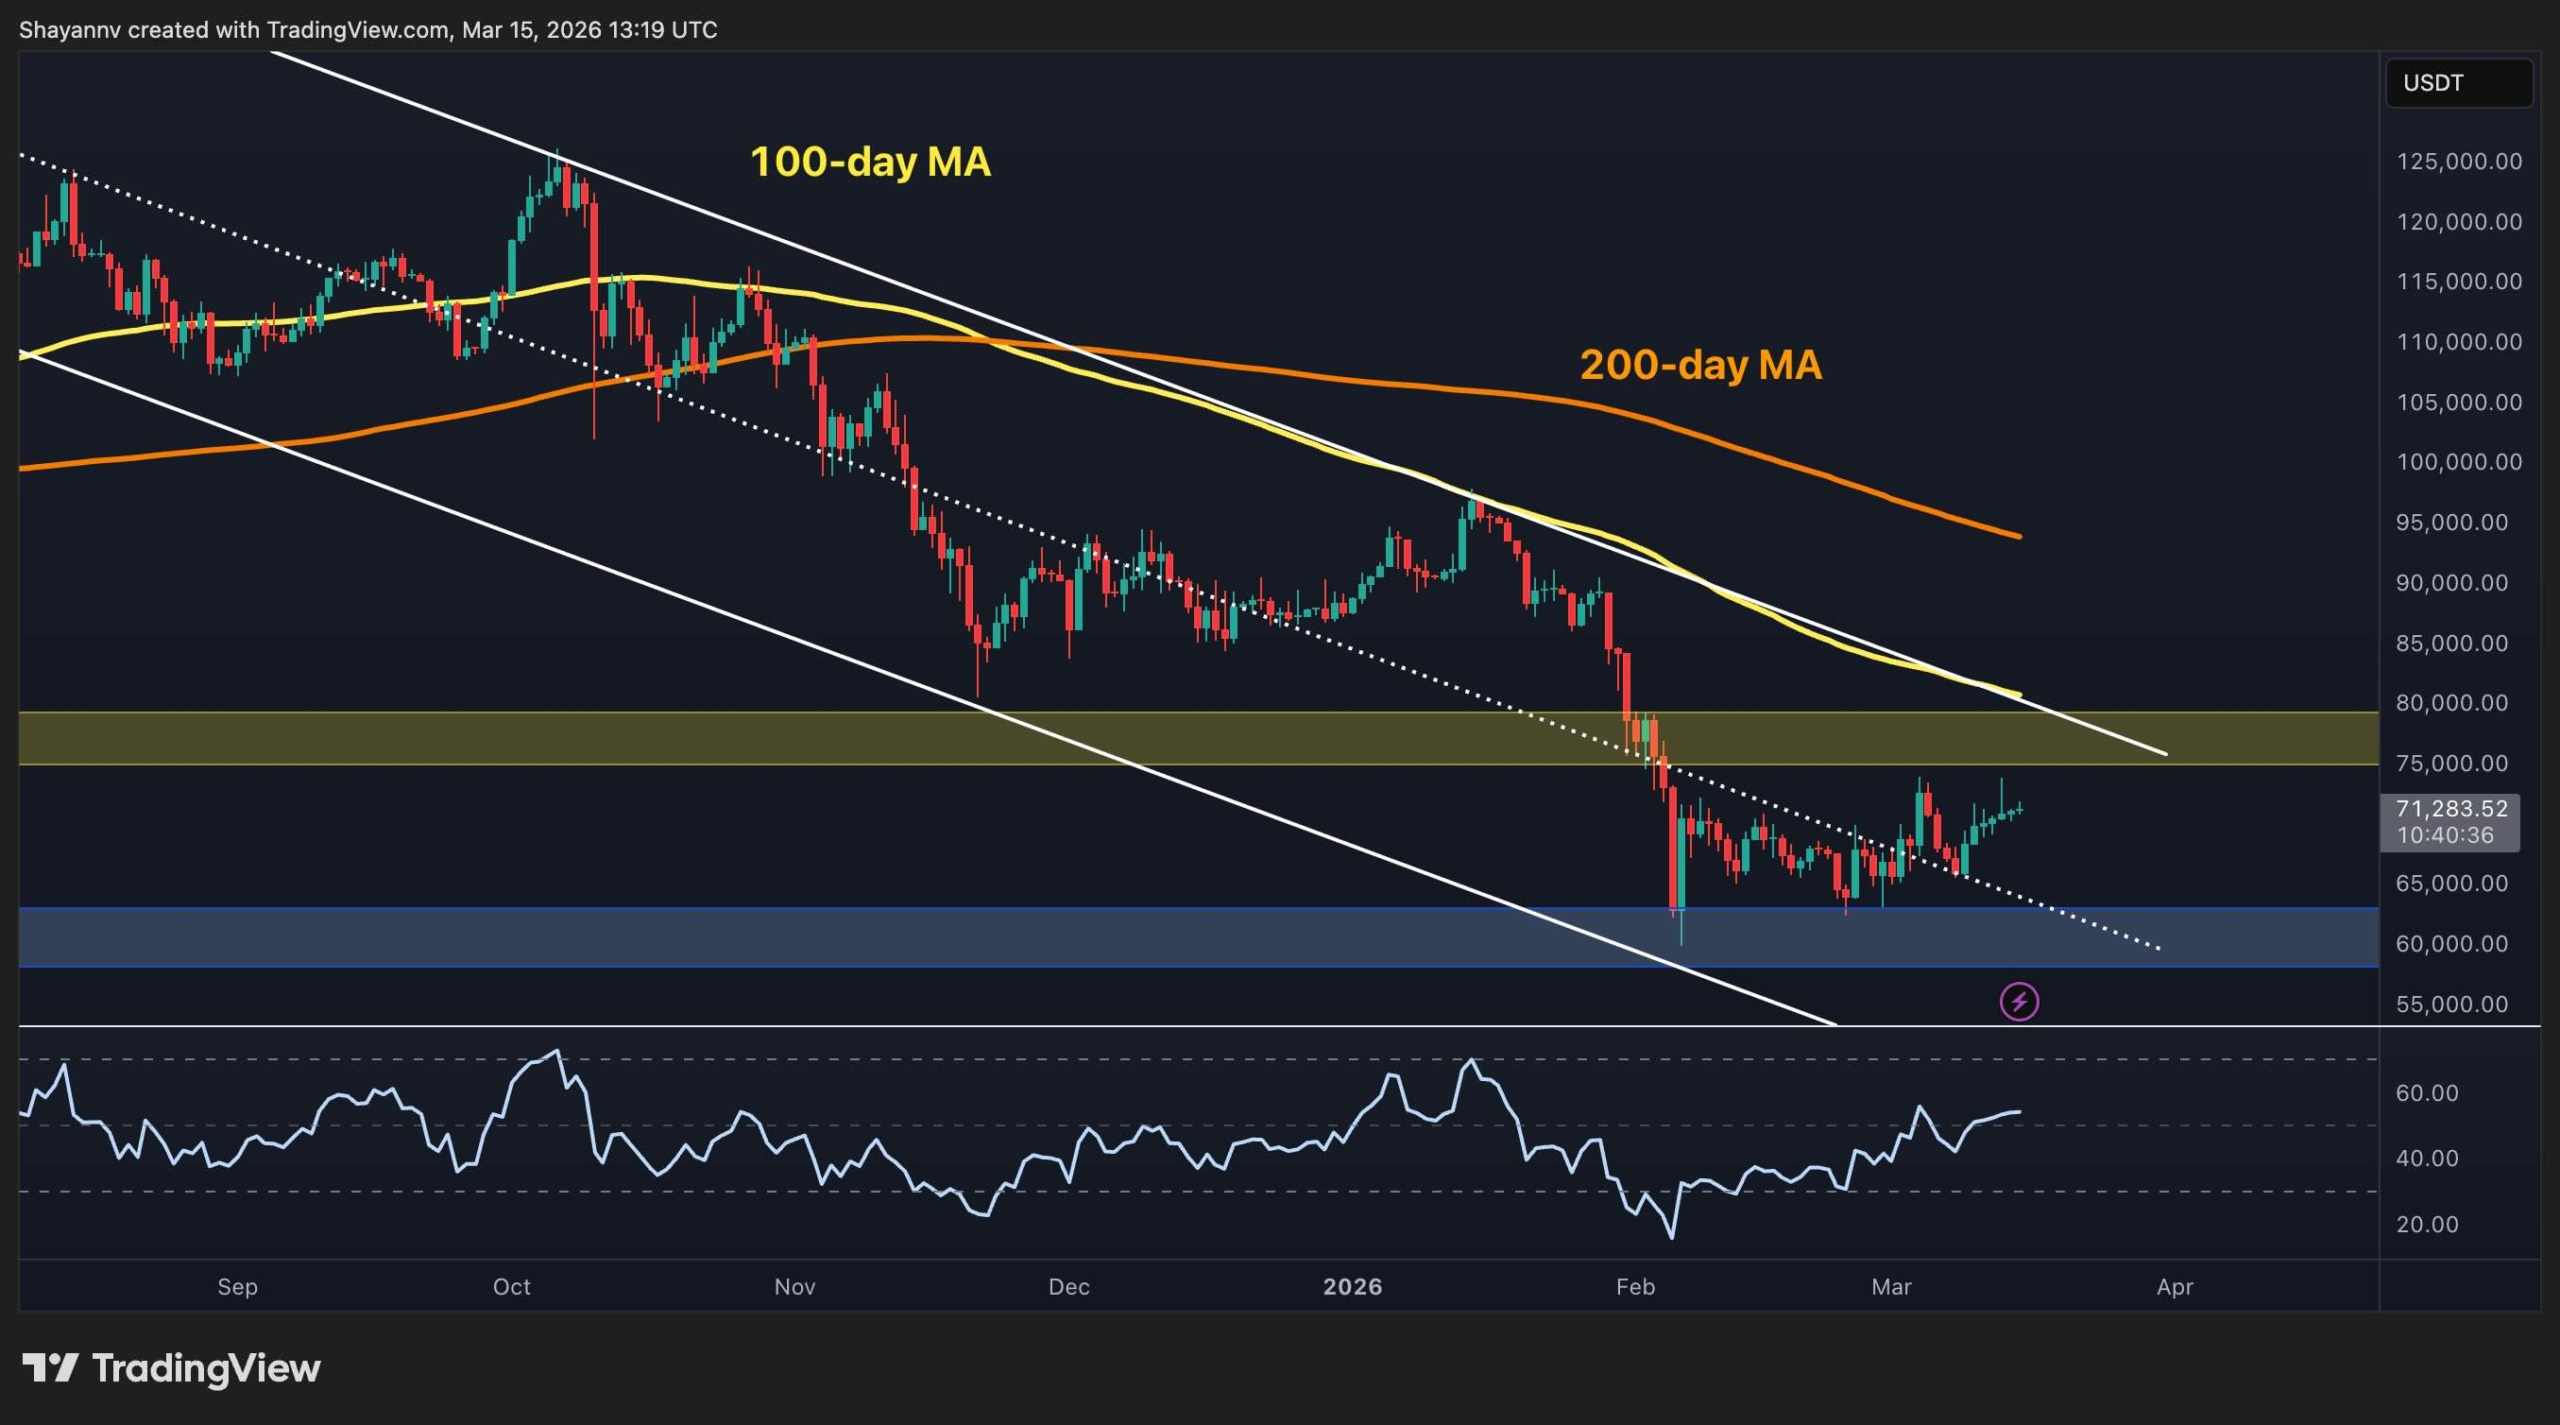
On the daily chart, Bitcoin continues to trade below both the 100-day and 200-day moving averages, keeping the higher-timeframe trend cautious. The price is also still sitting inside the broader descending structure, even though the latest rebound has clearly improved conditions compared to the panic sell-off seen near the February lows.
The key level to watch remains the $75,000 to $80,000 resistance area, which previously acted as support before turning into supply. As long as BTC stays below that zone, the broader move can still be interpreted as a rebound within a larger corrective phase. On the downside, the $60,000 to $62,000 area remains the main support base, and it is still the level buyers need to defend to preserve the current recovery structure.
BTC/USDT 4-Hour Chart
The 4-hour chart looks stronger. Bitcoin has been climbing within a rising channel, and price is once again pressing toward the upper boundary of that formation. The market is now trading around $71,000 to $72,000, with RSI also firming near the upper half of its range, which reflects improving short-term momentum.
That said, BTC is approaching a confluence zone where channel resistance overlaps with horizontal supply around $73,000 to $75,000. This makes the current area especially important. A clean breakout above it would strengthen the case for continuation into higher resistance, while another rejection could send price back toward the middle or lower end of the channel and keep the market in consolidation mode.
On-Chain Analysis
The on-chain picture adds a more constructive undertone. The Spot Average Order Size chart shows that recent activity is still being driven more by larger participants than by aggressive retail-style behavior. Historically, that kind of backdrop tends to be healthier than a move led by euphoric small buyers, because it suggests stronger hands are still active even as price trades below the cycle highs.
At the same time, the chart does not show the kind of broad retail frenzy usually associated with late-stage blow-off conditions. In practical terms, that means the current recovery still looks relatively controlled from an on-chain participation perspective. So while Bitcoin is facing an important technical resistance zone on the charts, the order-size data suggests the market has not yet entered a fully overheated phase.
Binance Free $600 (CryptoPotato Exclusive): Use this link to register a new account and receive $600 exclusive welcome offer on Binance (full details).
LIMITED OFFER for CryptoPotato readers at Bybit: Use this link to register and open a $500 FREE position on any coin!
Disclaimer: Information found on CryptoPotato is those of writers quoted. It does not represent the opinions of CryptoPotato on whether to buy, sell, or hold any investments. You are advised to conduct your own research before making any investment decisions. Use provided information at your own risk. See Disclaimer for more information.


")
Leave a Comment